

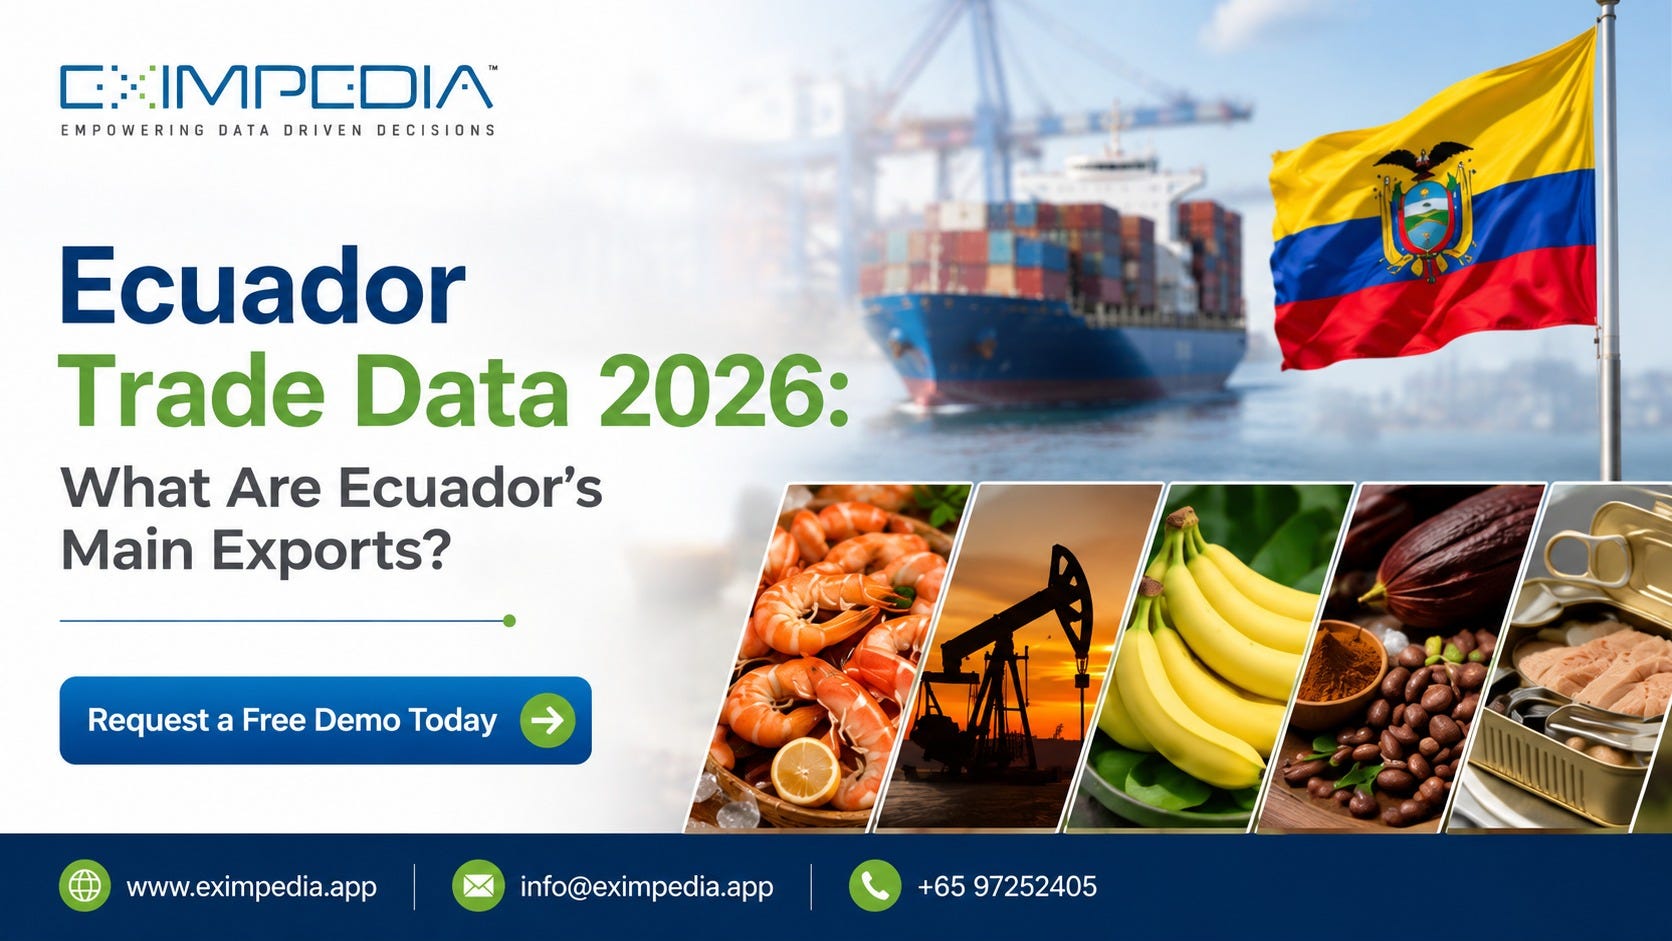
Ecuador’s main exports in 2025 were led by fish and shrimp at $8.8 billion, followed by crude petroleum at $7.8 billion, fruit (mostly bananas) at $4.8 billion, and cocoa at $4.7 billion, according to figures from the Observatory of Economic Complexity (OEC) and Trading Economics. Total exports of Ecuador reached roughly $37.2 billion for the year, a 7.9% increase over 2024. If you’re trying to size up this market fast, that’s the short answer. Everything below explains how those numbers were built, why they shift the way they do, and what they mean if you’re actually trying to buy or sell into Ecuador rather than just read about it.
Why Ecuador Trade Data Is Getting More Search Attention in 2026
Ecuador is a country of roughly 18 million people that punches well above its weight in global commodity trade. It adopted the US dollar as its official currency in 2000, which removes one layer of currency-risk headache for buyers and sellers dealing across borders. Its Pacific-coast ports, especially Guayaquil, move enormous volumes of refrigerated cargo every month, largely because shrimp, bananas, and flowers don’t wait around on a dock.
Interest in Ecuador trade data has climbed for a fairly simple reason: sourcing managers, freight forwarders, and import brokers got burned by outdated country reports during recent supply-chain disruptions, and they’ve since gotten pickier about where their numbers come from. A stale figure on shrimp volumes or oil pricing can throw off an entire quarter’s logistics plan, so more buyers now cross-check Ecuador trade data against two or three sources before committing to a purchase order.
The 2025–2026 Snapshot
According to the OEC, Ecuador shipped goods worth roughly $37.2 billion in 2025, up 7.9% from $34.4 billion the year before, and 41% higher than five years earlier. Per resident, that works out to about $2,050 in exports. Trading Economics data confirms the trend, showing monthly exports hitting a record $3.4 billion in November 2025, with imports for the same month running close behind at $3.1 billion. Anyone pulling Ecuador trade data for a sourcing decision should treat export value and import value as a pair, since the surplus — around $4.5 billion in 2025 — says a lot about the country’s current bargaining position with foreign buyers.
World Bank WITS figures and Statista’s product-level breakdowns both point the same way: this isn’t an economy built on one commodity. It’s spread across seafood, fruit, cocoa, and petroleum, which is part of why demand for these figures has grown among freight companies over the past two years.
Ecuador Main Exports: Category-by-Category Breakdown
Points, not a table, so this is easy to skim on a phone. These are the Ecuador main exports by 2025 trade value:
Fish, shrimp, and crustaceans — the largest category, worth roughly $8.8 billion, about 24% of total exports. Shrimp hit record volumes in the first half of 2025, with 719,000 metric tons shipped, up as much as 26% year-over-year.
Crude petroleum and mineral fuels — historically Ecuador’s top earner, still around $7.8 billion, roughly 21% of exports, though down nearly 19% as global oil prices softened.
Bananas and other fruit — around $4.8 billion, about 13% of the total. Ecuador remains one of the world’s largest banana exporters by volume.
Cocoa and cocoa products — a genuine growth story, up 29% year-over-year to about $4.7 billion, driven by strong global chocolate demand.
Ores, slag, and mining byproducts — smaller in absolute terms but growing fast, up nearly 48% to around $3 billion.
Cut flowers, gold, gems, and prepared meat or fish — each in the $1–2 billion range, rounding out a top ten that makes up over 92% of everything shipped abroad.
The exports of Ecuador, taken as a whole, lean heavily on things that spoil quickly, which is exactly why cold-chain logistics and reefer container availability matter so much to anyone buying from this market. Among the Ecuador main exports, seafood and produce alone account for more than a third of total value, and that share of Ecuador trade data keeps growing as oil’s contribution shrinks year over year.
Why Category Rankings Shift Year to Year
Cocoa’s 29% jump and ore’s near-50% surge in a single year show how fast Ecuador trade data can move. Buyers researching Ecuador main exports for the first time often assume the rankings are static — they’re not. A category that ranked fifth two years ago can move into the top three within a single trade cycle, driven by weather, global commodity pricing, or a shift in demand from a major buyer country. This is exactly why a year-old blog post is a weak reference point for anyone about to place a real order.
Where Ecuador’s Exports Actually Go
The United States remains the largest buyer, taking close to 18–28% of exports depending on the category measured. China follows at around 16–18%, and Panama — largely a re-export and transshipment hub — takes another 14–17%. Smaller but fast-growing shares go to the Netherlands, Spain, Chile, and Colombia.
Diversification Away From Traditional Buyers
Exports of Ecuador to the EU and to Asian markets outside China have both been climbing as the country reduces its reliance on any single buyer, a shift that shows up clearly once you compare shipment patterns by destination rather than just by product. This diversification is one of the more useful things to track in exports of Ecuador figures over time, and it’s a trend the data will likely keep confirming through the rest of 2026. For exporters, it also means new competition is emerging in markets that used to be dominated by two or three countries.
Also Read: Best Import Export Data Providers in 2026: How to Choose
Historical Trend: Five Years of Growth
Looking back helps put the current numbers in context. Exports of Ecuador stood at about $26.3 billion in 2021 and have climbed to $37.2 billion in 2025, a 41% increase over five years. That growth wasn’t linear — oil-driven years look different from seafood-driven years — but the overall direction of Ecuador main exports has been upward, even through periods of global commodity price volatility. Fish and shrimp have been the single biggest driver of that five-year climb, roughly doubling in value as farmed shrimp operations scaled up along the coast.
This longer view matters because a one-year snapshot of Ecuador main exports can make the market look either more volatile or more stable than it really is. A buyer who only checks the most recent monthly figure misses the structural shift already underway: petroleum’s share of total exports has been shrinking steadily since 2021, while seafood and agricultural categories have been absorbing that share. Anyone building a multi-year sourcing strategy around exports of Ecuador should weight the five-year trend line more heavily than any single quarter.
How Buyers Can Use This Data Practically
Knowing that Ecuador main exports lean toward seafood and produce is only useful if it changes what you actually do. For buyers, that typically means three things: building relationships with exporters who have consistent, verifiable shipment histories rather than one-off sellers; planning around known seasonal peaks for shrimp and bananas instead of assuming flat monthly output; and treating oil-linked categories as more volatile than agricultural ones when forecasting supplier pricing. None of that comes from a single country-level total — it comes from tracking exports of Ecuador at the shipment and HS-code level over time, which is a different exercise from reading a yearly summary.
Why Country-Level Totals Aren’t Enough for Sourcing Decisions
Raw export totals make a good headline, but sourcing decisions live in the details: which exporter shipped what, at what price, through which port, and how consistently. General Ecuador trade data from macro sources like WITS or Statista runs out of road here — excellent for direction and scale, not for building a supplier shortlist. If you’re trying to identify actual Ecuadorean shrimp or cocoa suppliers with a verifiable shipment history, a platform like Eximpedia.app is worth a look for that layer of buyer-supplier detail, since it works from shipment-level records rather than aggregated country totals.
The exports of Ecuador move enough from month to month that last season’s supplier list can already be outdated by the time a shipment clears customs. Relying on a single static number, instead of tracking Ecuador trade data on a rolling basis, is one of the more common and avoidable mistakes new buyers make in this market, and it’s the single biggest gap between casual research and Ecuador trade data that’s actually usable for a purchase order.
Common Mistakes When Reading Ecuador Trade Data
A few patterns come up again and again among people new to this market. First, confusing value with volume — a category can rise in dollar terms purely because of price inflation, not because more product actually moved. Second, ignoring seasonality — bananas, shrimp, and flowers all have production cycles that swing monthly totals noticeably, so a single month’s snapshot can be misleading. Third, treating Panama’s large share as final demand, when in reality much of it is re-exported onward to other Latin American and Caribbean markets. Reading Ecuador trade data without accounting for these three issues leads to sourcing plans that look solid on paper and fall apart at the port.
Frequently Asked Questions on Ecuador Trade Data
Q1. What is Ecuador’s biggest export right now?
Fish and shrimp, particularly crustaceans, currently top the list of Ecuador main exports at around $8.8 billion in 2025, ahead of crude oil.
Q2. Why is Ecuador’s oil export share dropping?
Global oil prices softened through 2025, pulling petroleum exports down nearly 19% even as production stayed roughly steady — a common question on trade forums when people compare year-over-year totals.
Q3. Is Ecuador a bigger shrimp exporter than India or Vietnam?
Ecuador is generally considered one of the top two or three global shrimp exporters by volume, competing closely with India and Vietnam depending on the year and season measured.
Q4. What countries does Ecuador export the most to?
The United States, China, and Panama are the three largest destinations, followed by smaller but growing shares to the Netherlands and Spain.
Q5. Does Ecuador have a trade surplus or deficit?
Ecuador ran a trade surplus of roughly $4.5 billion in 2025, with exports outpacing imports thanks to strong shrimp and cocoa performance.
Q6. Where can I find reliable, up-to-date Ecuador trade data instead of outdated blog stats?
Government and research sources like OEC or WITS are solid for trend-level numbers, but for shipment-level buyer and supplier detail, a platform such as Eximpedia.app is generally a better starting point if you need current, granular data rather than an annual summary.
Why does cocoa keep showing up in Ecuador trade news lately?
Cocoa exports jumped 29% year-over-year in 2025 on strong global chocolate demand, making it one of the fastest-growing categories in the country’s export mix.
Sources
Observatory of Economic Complexity (OEC) — oec.world/en — Ecuador export totals, five-year growth, per-capita figures, top destination countries.
Trading Economics — tradingeconomics.com/ecuador/exports — monthly export/import values, category share breakdowns, historical trend data.
World Bank WITS — wits.worldbank.org — international tariff and trade composition analysis used for cross-verification.
Statista — statista.com — product-level export value breakdowns by trade category.